
It’s that time again! I’m linking up with the fabulous Jasmine McClain for the You Oughta Know Blog Hop. This month I really think you oughta know about the importance of graphing in the primary classroom.
Do you make graphs with your students? Of course you do, who doesn’t? But do you know why it is important and what experiences your students should have to get the most out of graphing activities?
Why is graphing so important?
1. Graphs can engage students and create enthusiasm for math.
2. Graphs can be integrated into any subject, showing students the real world application and purpose for learning math concepts.
3. Graphs give students the opportunity to represent, compare and discuss mathematical relationships and concepts in new ways.
- Collecting information
- Tallying information
- Counting data points
- Surveying peers or others
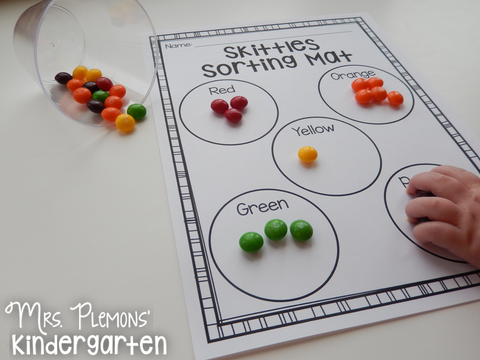
- Sorting objects
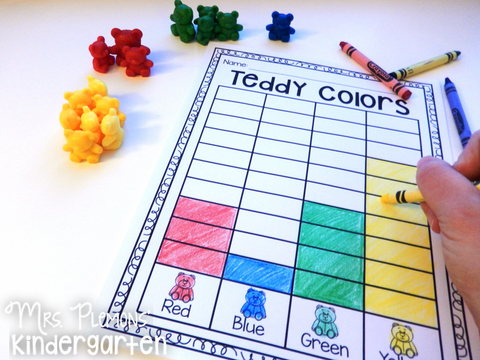
- Making graphs with real objects
- Making picture graphs
- Reading graphs
- Making observations from a graph
- Comparing results with a friend
- Asking questions about a graph
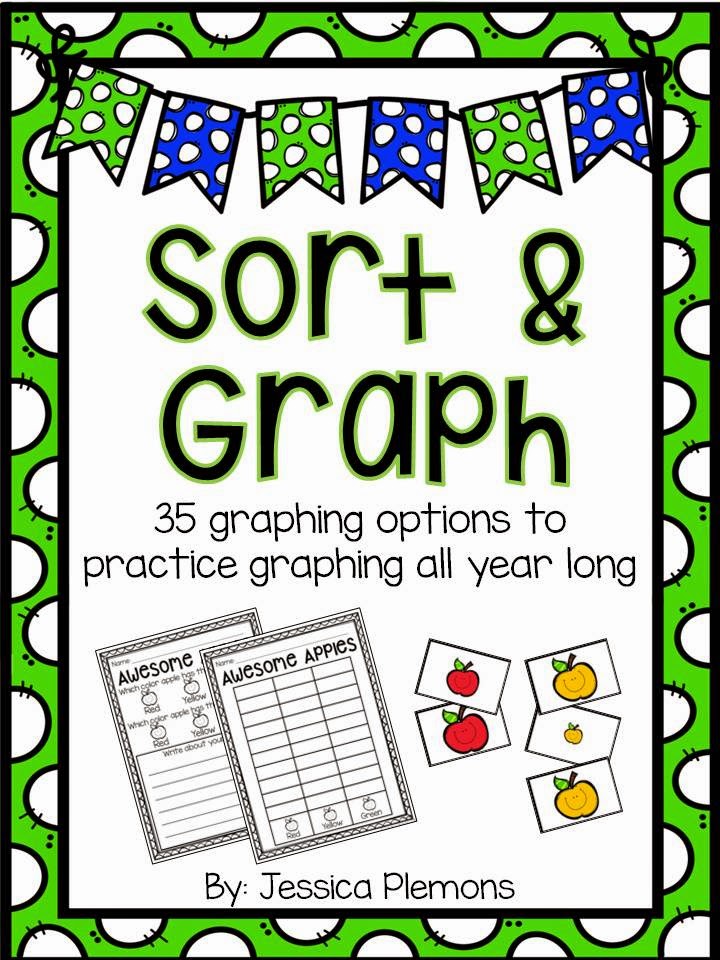
Using real objects is a great way to get started on graphing with young students. Gather any of those awesome math manipulatives or art supplies you have hanging around your classroom. They are great for graphing, by size, color, or type. Students can sort them and line them up on your table. You can then have students translate this information into a bar or picture graph. Learning to represent data in different ways is a key understanding for mathematical success.
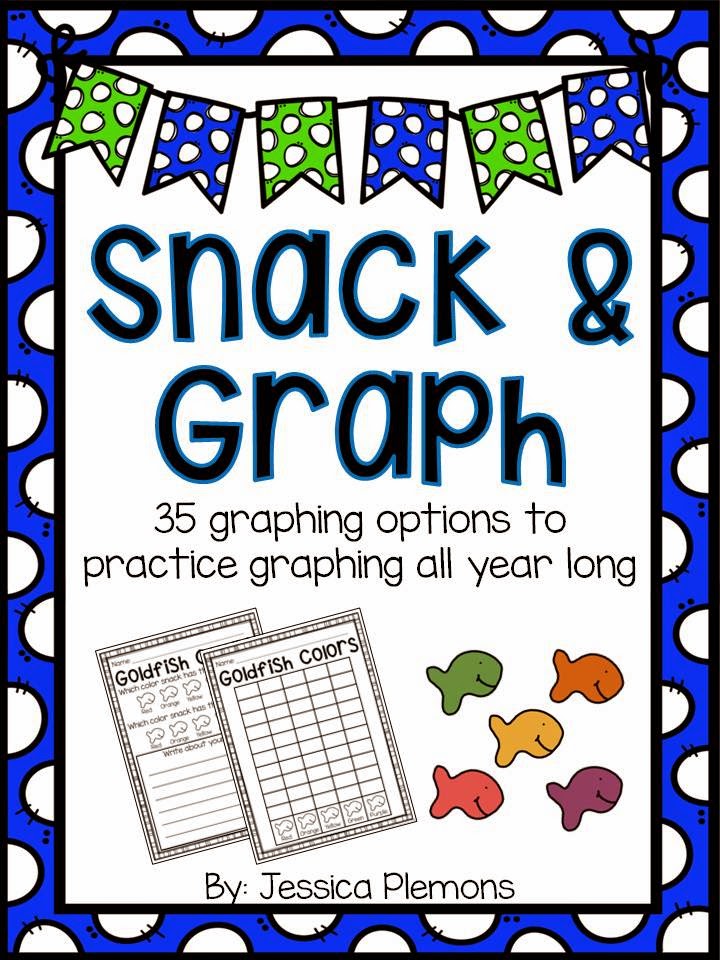
Snacks are another one of my favorite items to graph with students. I used to love sorting my snacks into groups as a child and kindergarteners seem to do this naturally during snack time in my class anyways. So why not take advantage of this opportunity and have students create a graph and make observations about their data.

Teaching students to take surveys to collect data is another way to introduce a real world application of graphing. Maybe you are having a class ice cream party and need to know what flavor everyone would like. Or maybe a child wants to plan their birthday party at the local pool and wants to know if their friends can swim. Surveys are a quick efficient way to collect and organize the information you need.
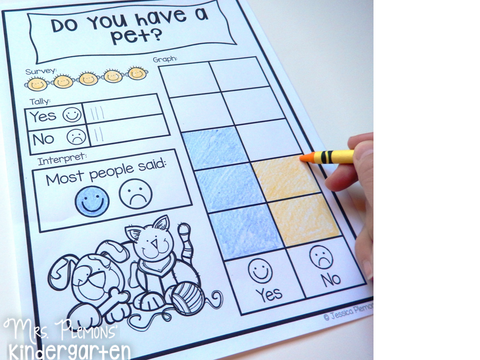

So you’ve created a gorgeous graph, now what? Teaching students to analyze and interpret information from a graph is the ultimate goal. When we encounter graphs in real life we need to be able to gather information and understand what the graph is showing us. Using open ended questions are a great way to start to get students talking about a graph. I often ask my students to write what they notice about their graph. I tend to ask what has most and least first to get that out of the way, otherwise this can easily become the only information students feel is important to write about.

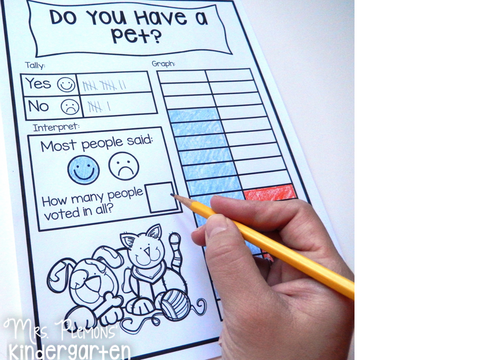
After students have the opportunity to tell what they notice you can ask follow up questions about things students may not have noticed.
- Which item has most/least?
- Which item has more/less than ___?
- Which items have the same?
- How many items were there in all?
- How many more ___ than ___?
- What did you have the most of? How is that different from your friend?
- Why do we have different data?
- Are there any patterns we see across multiple graphs?
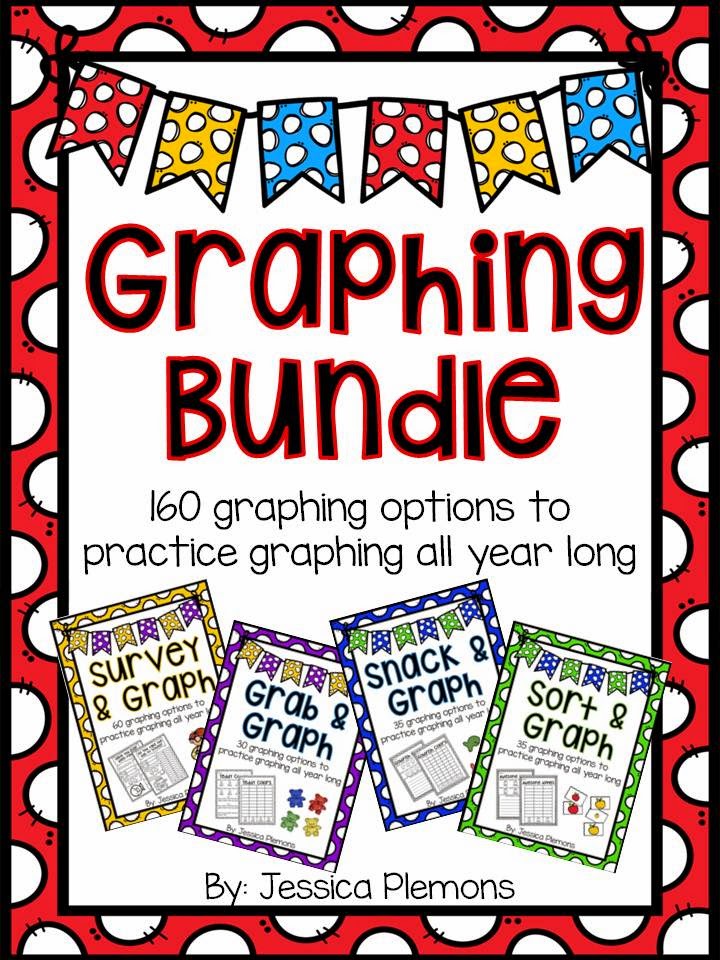
Looking for some resources to help you get started on graphing in your classroom? Here are 3 FREEBIES for surveying, sorting and graphing.


I teach upper elementary, but I LOVE seeing all the posts about what the little ones are doing! It's so fun to see how it grows. It also never ceases to amaze me when the littles are doing "tough" stuff like this- so incredible!
Mandy
Caffeine and Lesson Plans
Thanks Mandy! I try so hard to push my kids to think deeply in all areas 🙂
I love teaching Data Handling in school- we feed it into every subject area like you said and, in-fact, we are having a Fairytale dress-up day on Monday and will be collecting data and graphing the different types of characters we come dressed as. Thank-you so much for sharing the freebies and reminding me just how important this skill is Xx
We just finished up graphing with Eureka Math and we did a lot of creative things with it. We really focused on interpreting the data from the graphs which is such an important skill! Thanks for joining the link up again. I always love your posts girl!
Jasmine
Buzzing With Mrs. McClain
Thanks for sharing the freebies. Anything that gets kids engaged and excited is a good thing.
Graphing is so essential for them to understand the comparison of numbers. It helps them to understand the abstract concept in a visual way~ but I love how you've also made it concrete!
Wiggling Scholars
I just introduced graphing on Valentine's Day when we graphed our candy hearts. I have never seen my kids so engaged in math! Thank you for sharing your ideas! I'm looking forward to taking them back to my students to extend their love of graphing.
Kelsey
Simply Magical Learning
Great post about graphing with little ones. My first graders love to graph! I would say their favourite part is conducting surveys of their classmates.
Christina
Hanging Around In Primary